
Quantifying Long Term Asset Atrophy From Persistent Threat Driven Capital Allocation Shifts
Persistent defensive resource reallocation accelerates productive asset decay, creating non-linear restoration premiums that exceed deferred maintenance savings.
Shock
Direct defense against an active operational hazard consumes immediate cash, while the secondary decay of untended infrastructure proceeds out of sight. Corporate balance sheets record defensive expenditure under emergency legal, technical, or compliance line items within the current reporting cycle. The concurrent degradation of unmaintained machinery, untended codebases, and unrefreshed client relationships escapes periodic operating statements.
Threat containment absorbs liquid funds immediately. Core earning capability degrades over multi-year horizons.
Acute risk management and structural balance preservation pull capital in conflicting directions. When an existential operational threat emerges, leadership redirects liquid reserves toward defensive buffers. Cash reserves designated for capital expenditure, routine plant maintenance, and exploratory development move to emergency contingency accounts.
The immediate danger recedes or stabilizes under constant mitigation. The underlying productive engine, starved of continuous replacement capital, quietly sheds operational efficiency.
Threat absorption consumes immediate liquidity while structural capability erodes beneath the observation threshold.
Standard accounting conventions treat deferred maintenance as an invisible credit against current operational costs. Postponing hardware upgrades or freezing codebase remediation preserves nominal cash balances during threat abatement. The deferred investment silently reduces the useful life of the underlying asset base.
The baseline deteriorates. Unaddressed mechanical or digital friction compounds exponentially over operational quarters.
Distinguishing Acute Outlays From Cumulative Physical Decay
Direct mitigation outlays carry explicit invoices from security contractors, legal counsel, and specialized restructuring advisors. Physical asset neglect carries no invoice until an operational component breaks under ordinary stress. Evaluating cumulative atrophy requires separating the visible expense of active crisis containment from the progressive devaluation of productive apparatus.
A manufacturing plant running continuous shifts without scheduled overhaul illustrates the divide. Threat mitigation forces the line to run without planned downtime to satisfy emergency delivery quotas. Component surfaces score, bearings overheat, and tolerances drift past factory specifications.
Operating through a persistent threat environment exhausts internal redundancy. Physical machines and digital pipelines require continuous reinvestment simply to preserve baseline throughput. Freezing capital allocation toward asset replenishment forces existing tools to absorb unsustainable duty cycles.
Wear accumulates in silence. Treating defensive survival as operational parity produces balance sheets that show solvent capital reserves right up to the morning the main spindle shears.
Shunt
Emergency capital reallocations follow predictable pathways away from long-term asset integrity. When systemic threats persist beyond a single quarter, defensive budget lines become permanent operational fixtures. Discretionary capital expenditure budgets vanish first, followed by preventive equipment servicing schedules, and lastly continuous staff development programs.
Cash stops flowing toward modernization. The diversion of resources creates an expanding deficit between the operational capacity required to compete and the actual capacity maintained on site.
Threat-driven resource diversion corrupts multiple asset classes simultaneously through specific operational channels.
- Preventive maintenance suspensions cancel planned mechanical downtime and digital patching cycles to keep defensive throughput continuous.
- Capital renewal deferrals postpone the scheduled replacement of depreciating field assets to preserve liquid cash reserves for crisis contingencies.
- Knowledge asset liquidation leaves open technical vacancies unfilled during freezes, dissolving undocumented institutional procedural memory.
- Secondary supply compromises substitute lower-grade input materials to preserve margins during prolonged regulatory or legal disputes.
Quantifying Capital Redirection Away From Baseline Integrity
Measuring the diversion velocity requires tracking capital expenditure variance against pre-threat baseline trajectories. In a normal operating state, capital renewal matches or exceeds physical depreciation schedules to preserve productive capacity. Under persistent threat allocation, capital additions fall below baseline depreciation rates.
The resulting negative investment delta measures the rate of structural atrophy. Attention remains divided.
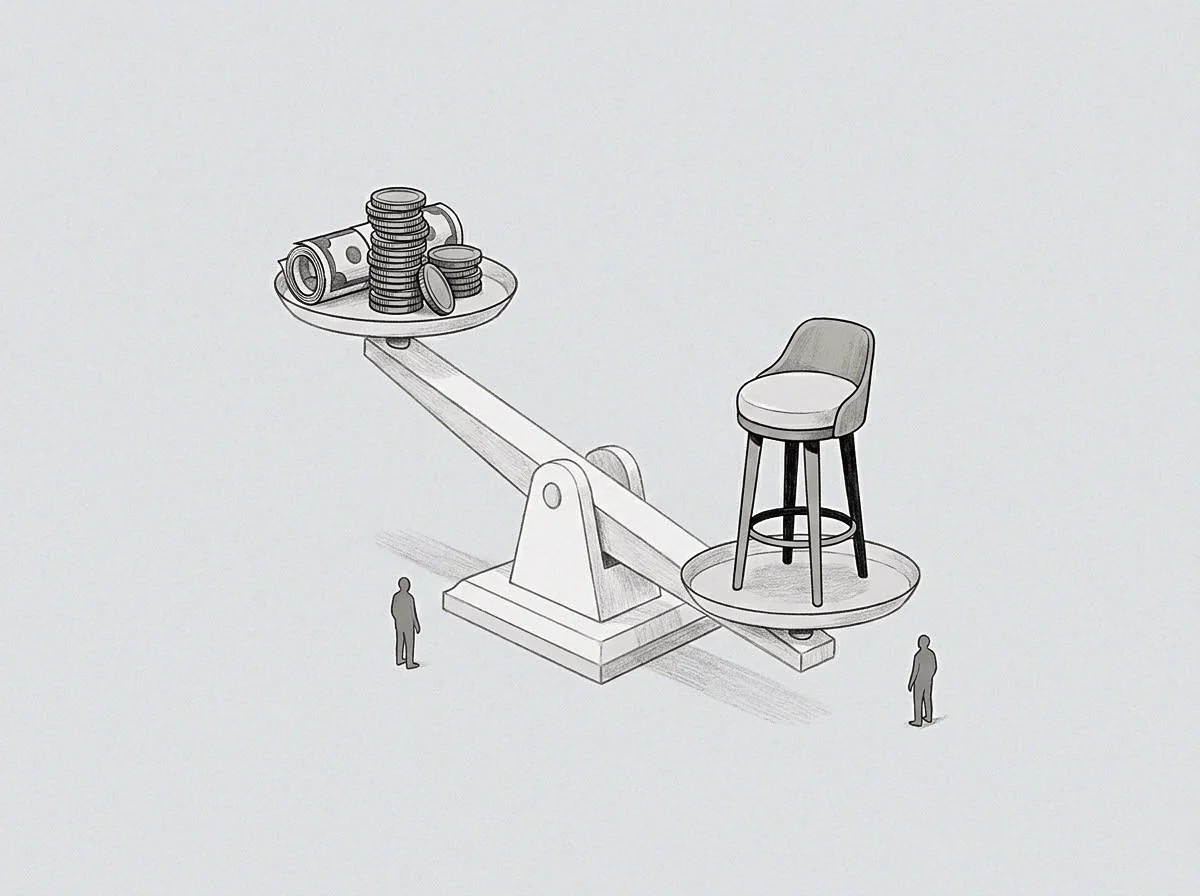
Consider an enterprise generating fifty million dollars in annual operating earnings that allocates eight million dollars annually to physical asset renewal. A persistent threat forces leadership to divert five million dollars per year into protective reserves and risk mitigation. The direct threat cost is five million dollars annually.
The secondary cost consists of the three million dollar annual shortfall in maintenance capital, compounded by elevated utilization rates on unserviced machines. Neglect degrades core capability. The loss of operational efficiency accelerates past the linear sum of withheld funds.
Withholding asset renewal capital during prolonged crisis response creates non-linear operational drag across subsequent cycles.
Capital reallocation also consumes finite executive oversight. Every hour senior leadership spends coordinating defense against external threats is an hour removed from operational asset stewardship. Facilities degrade, technical debt expands, and supplier contracts lapse without executive review.
The slot stays occupied. Physical and digital plants drift away from peak operational efficiency while attention concentrates on crisis containment.
A persistent threat shunts capital away from physical durability until baseline operations stall under ordinary working conditions.
Shelf
Neglected productive units sit idle or operate under degraded performance profiles when renewal capital disappears. Physical tooling, transport fleets, data warehouses, and proprietary processing systems develop chronic operational flaws under reduced maintenance regimes. Tracking this degradation demands systematic comparison across asset categories exposed to prolonged resource starvation.
The engine stalls. The structural consequences of sustained capital starvation vary across tangible physical plant and intangible technical systems.
| Asset Class | Initial Diversion Impact | Compounded Atrophy Profile | Recovery Hurdle |
|---|---|---|---|
| Precision Machining | Skipped lubrication cycles and delayed calibration | Tolerance drift, bearing seizure, elevated scrap rates | Complete spindle rebuild or full tool replacement |
| Software Architecture | Frozen dependency updates and bypassed refactoring | Technical debt lock-in, recurring micro-outages | Full architectural rewrite under live production |
| Logistics Fleet | Deferred suspension overhauls and tire life extension | Catastrophic roadside failures, cargo loss risks | Premature chassis retirement and accelerated fleet leasing |
| Institutional Skill | Hiring freezes and halted internal apprenticeship | Loss of unwritten operational heuristics and diagnostic speed | Multi-year recruitment and training cycles |
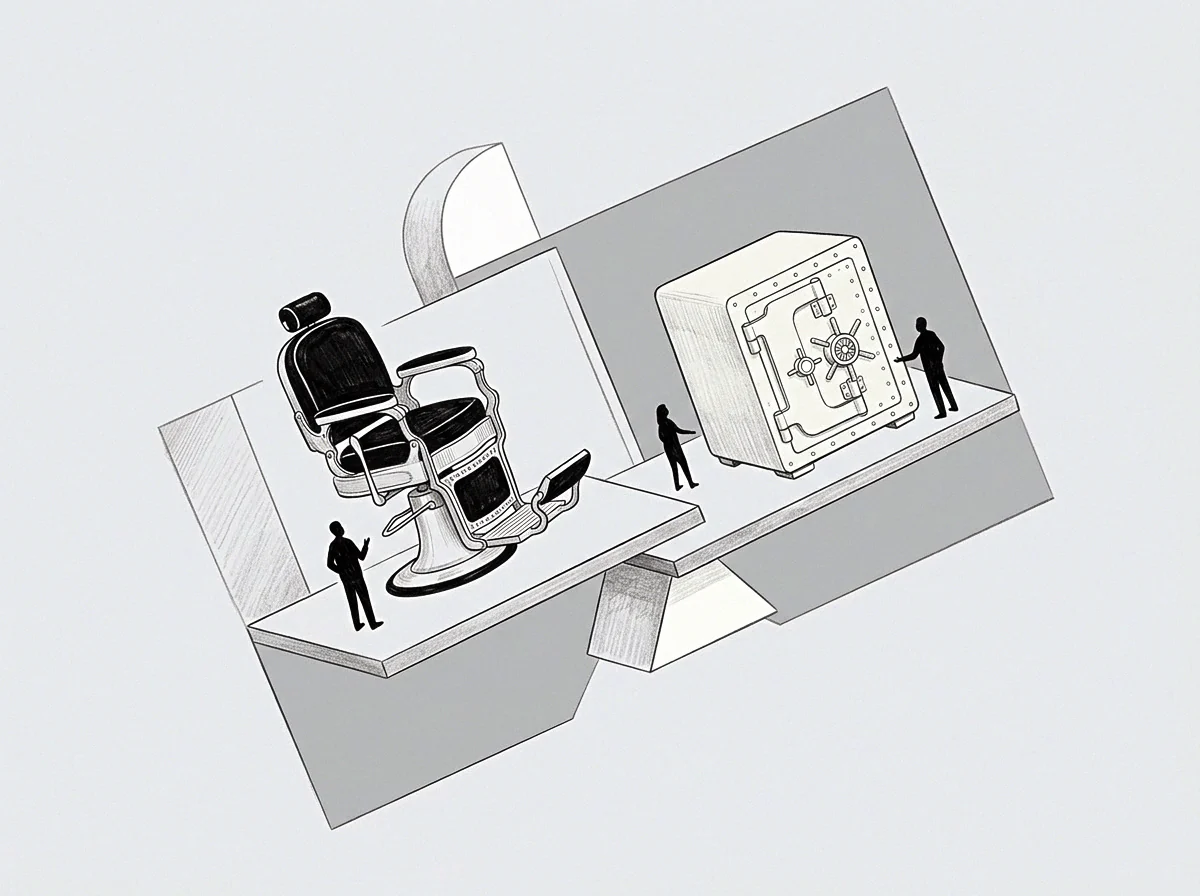
Tracking Structural Deterioration Across Physical Inventories
Physical tooling left unserviced undergoes measurable mechanical wear that accelerates with every operating hour. In precision fabrication, thermal stress and unlubricated friction cause microscopic warping in metal guides. Scrap rates climb from one percent to four percent over six months of skipped calibration.
The balance drops. By month eighteen, the machinery produces tolerances unsuitable for high-margin contracts, forcing the enterprise into lower-tier commodity markets.
Software environments suffer parallel physical constraints through memory leakage, unoptimized queries, and outdated dependencies that exhaust server clusters. A digital pipeline deprived of ongoing architectural maintenance consumes twice the compute power to process baseline transaction volumes. Compute costs rise, masking asset degradation as an operating utility expense.
Hardware runs hot. Server fans spin at maximum velocity, cooling components that are burning excess power to overcome software inefficiencies caused by neglected refactoring.
A machine running without scheduled calibration converts unallocated maintenance capital into finished scrap material.
Intangible operational capital atrophies just as visibly inside the workplace. Skilled senior technicians forced to operate broken equipment face continuous cognitive exhaustion and operational friction. Senior staff leave for stable environments, taking unwritten operational procedures and maintenance heuristics with them.
Junior operators lack the diagnostic intuition required to nurse damaged machines through daily shifts. The room empties. Unrecorded institutional knowledge dissolves faster than physical steel corrodes.
The machinery ran yesterday without incident, so the scheduled overhaul can wait another quarter.

Slag
Deferred maintenance leaves a calcified residue of structural inefficiencies across the entire operating apparatus. This organizational and physical slag consists of accumulated mechanical wear, obsolete firmware, patched piping, and improvised workarounds. Removing this buildup requires significantly more capital than the original maintenance would have consumed.
The reserve drains. The cost of restoring an atrophied asset increases non-linearly with the duration of the capital allocation drought.

Can Maintenance Deficits Compound Across Successive Threat Cycles?
Asset decay does not follow a linear depreciation trajectory during periods of defensive capital starvation. Neglect operates through positive feedback loops where unaddressed minor defects trigger catastrophic secondary component failures. A worn timing belt left unreplaced does not merely stop working; it snaps at speed, bending valves and destroying engine cylinder walls.
Threats consume liquid reserves. The eventual repair bill exceeds the cost of twenty scheduled timing belt replacements.
Quantifying this compounding atrophy requires modeling three interconnected operational variables over the diversion timeline.
- The baseline decay coefficient tracks the standard physical depreciation of the asset under normal operating conditions.
- The stress multiplier measures the accelerated wear caused by running unserviced equipment beyond recommended maintenance intervals.
- The remediation inflation curve calculates the escalating financial and downtime penalty required to restore degraded systems to baseline efficiency.
When the stress multiplier interacts with the remediation inflation curve, the recovery cost outpaces original asset values. Industrial facilities facing multi-year litigation or regulatory pressure frequently find their production lines reduced to salvage value. The physical plant remains standing on the corporate ledger at historical cost minus conventional depreciation.
The reality on the shop floor reveals machinery so worn that restoring factory tolerances demands complete scrap and replacement. The ceiling drops.
Restoring an atrophied productive apparatus requires premium capital to clear compounded physical and technical debt.
The gap between reported net asset value and real operational replacement value represents latent balance sheet decay. Auditors observing conventional depreciation schedules miss the real rate of destruction caused by skipped maintenance. The machinery slows down.
Lenders underwriting facilities against historical asset book values discover too late that neglected collateral cannot generate the cash flow required for debt service.
A contractual loan covenant that permits the borrower to defer routine capital reinvestment during legal contingencies ensures collateral values collapse before debt maturities mature.
Toll
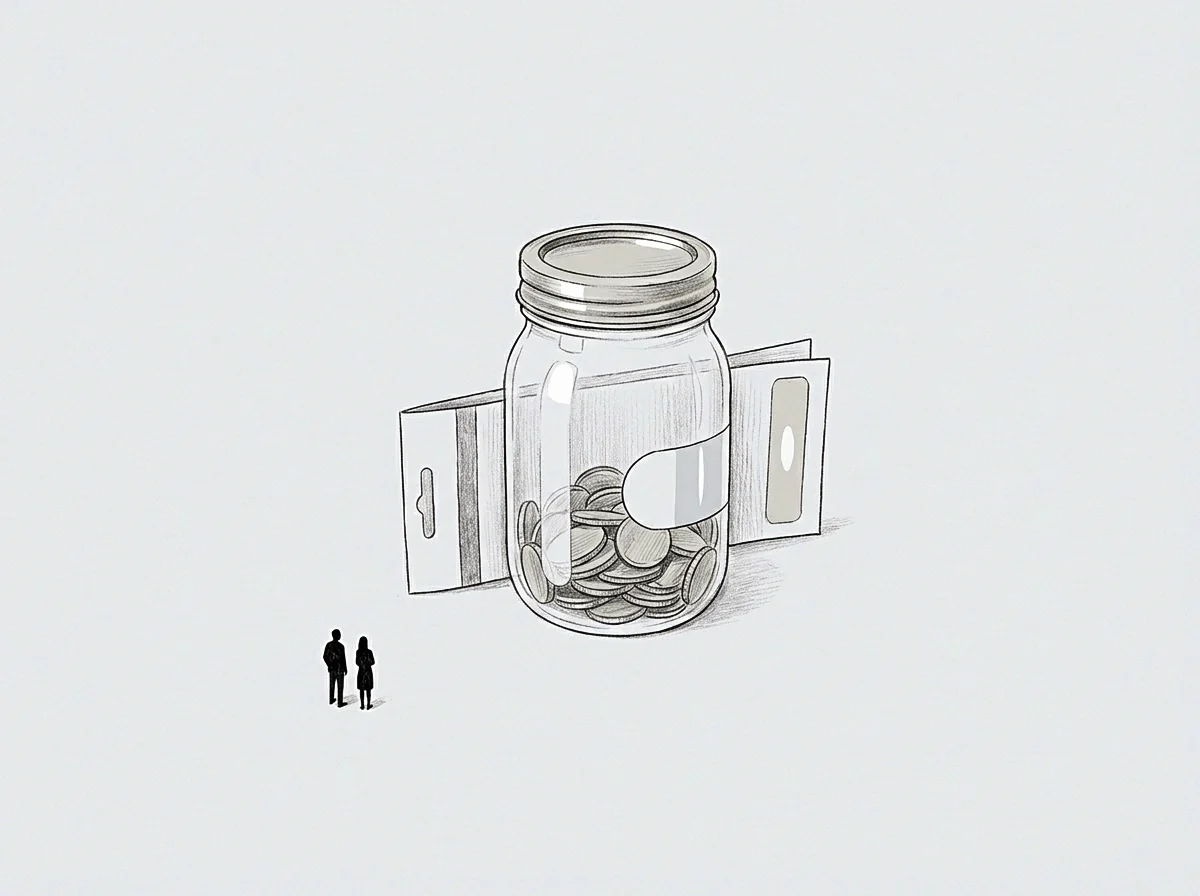
The ultimate reckoning arrives when the defensive crisis abates and leadership attempts to resume normal commercial competition. Enterprises emerge from threat mitigation with cash intact but productive engines hollowed out by multi-year underinvestment. The true cost of the threat includes the direct defensive spend and the entire accumulated asset remediation deficit.
Recovery demands fresh capital. Rebuilding neglected assets requires competing for specialized replacement equipment while operating at reduced capacity.
Quantifying total accumulated asset atrophy requires establishing the net restoration premium across all degraded divisions. The restoration premium equals the total cost of immediate replacement minus the theoretical maintenance capital saved during the crisis. In industrial settings, this premium ranges between one hundred fifty and three hundred percent of the deferred capital expenditure.
Deferred repair carries interest. Premature asset write-downs, emergency contractor premiums, and lost customer goodwill during prolonged outages drive this financial penalty.
The enterprise that survived the operational threat now finds itself uncompetitive against well-capitalized peers who maintained steady reinvestment cycles. Delivery lead times lengthen because machines operate at reduced speeds to prevent terminal failure. Product rejection rates climb due to uncorrected tooling drift.
Margins compress under the combined weight of high operating scrap and emergency maintenance callouts. The physical plant limits the strategic choices remaining on the table.
What remains undetermined is whether leadership can identify the exact inflection point where continuing defensive capital diversion destroys more enterprise value than the external threat itself would have consumed.