
Determining System Throughput Failure Points Under Continuous Unthrottled Operations In High Velocity Engineering Environments
Continuous unthrottled operations force internal execution queues past capacity limits, shifting failure points from edge ingress to downstream thread pool exhaustion.

Friction
Engineers monitor production metrics across multiple dashboards while incoming request volumes surpass baseline capacity. Systems operating without ingress throttling absorb raw traffic spikes directly into execution threads. When incoming queues run without hard rate bounds, performance degradation shifts from external entry gates deep into execution layers.
Internal worker pools consume available memory allocation, processing each unit of work until physical limits halt operations entirely.

Queue Saturation Across Continuous Execution Paths
Buffer pools absorb initial traffic bursts before thread exhaustion halts downstream execution. Asynchronous tasks accumulate within memory arrays when consumption rates exceed worker completion speeds. The queue grows steadily, extending processing times for every pending operation.
Memory allocation increases monotonically during continuous operations, leaving zero headroom for transient garbage collection cycles.
Thread pools lock up as pending tasks contend for shared locks across processing cores. The system continues accepting work because edge proxies lack feedback metrics from internal queues. Resource exhaustion occurs internally while surface monitoring endpoints register valid connections.
Data streams pile up in heap memory. Operations slow down.
Consider a distributed messaging service configured without rate limits under a continuous payload stream of forty thousand events per second. The ingress worker nodes allocate incoming payloads directly into in-memory storage arrays. Over a four-hour window, heap utilization escalates from forty percent to ninety-eight percent.
Processing latencies rise from twelve milliseconds to seven seconds as CPU cycles spend time on memory re-allocation rather than execution. The system fails silently without returning explicit error codes to calling clients.

Unthrottled Ingress and Resource Allocation
Ingress control mechanisms determine how infrastructure responds under operational saturation. Operating without fixed limits exposes application runtimes to uncontrolled concurrency expansion. Operating systems allocate available socket descriptors until kernel tables fill completely.
Incoming packets wait in network interface queues while application worker threads attempt to process locked data structures.
Memory pressure triggers operating system kernel sweeps to reclaim physical memory. Worker processes pause during these kernel operations, creating artificial execution gaps across active services. Pending connections accumulate during pauses, amplifying queue depth across all system interfaces.
Internal dependencies collapse as upstream services time out waiting for stalled worker threads.
Failure to establish hard ingress limits forces application runtimes into catastrophic memory exhaustion under sustained peak traffic.

Bench
Physical diagnostic hardware records exact memory addresses during sustained operational stress. Monitoring raw hardware signals exposes execution bottlenecks that software instrumentation fails to catch. High-velocity engineering setups require continuous profiling directly at the kernel boundary to isolate exact resource boundaries under peak load conditions.
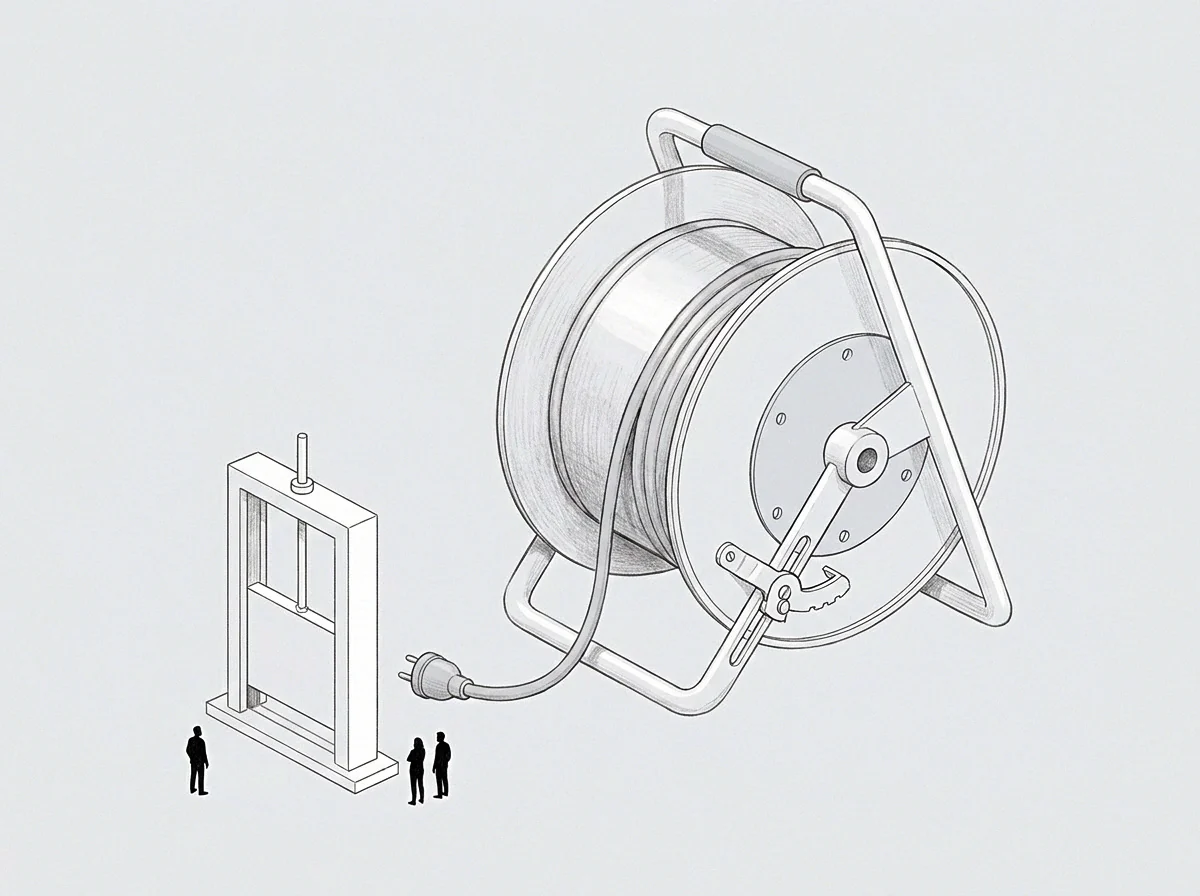
Hardware Profiling Under Continuous Load Stress
Telemetry collection tools sample system state every ten milliseconds to catch subtle allocations. CPU instruction pipelines reveal persistent stalling when cache line invalidations increase under high core contention. Core synchronization locks create bottleneck points that remain hidden during low-volume benchmark tests.
Operational efficiency drops as worker threads spend execution cycles waiting for lock release events.
Disk input and output operations degrade rapidly when virtual memory paging begins. Kernel page swaps introduce orders of magnitude in operational latency. High throughput targets become unachievable once application memory maps spill onto swap space.
System metrics register extreme CPU utilization, but effective transaction output drops to zero.
| Operational State | Ingress Rate | Memory Usage | Failure Manifestation |
|---|---|---|---|
| Baseline Processing | 10k req/sec | 45 percent | Zero dropped packets |
| Saturated Buffer | 25k req/sec | 82 percent | Elevated latency tails |
| Unthrottled Exhaustion | 50k req/sec | 98 percent | Silent packet loss and thread deadlock |

Why Do Cascading Latencies Mask Core Failure Points?
Upstream services report normal health status while backpressure builds silently inside internal buffers. Dependency graphs propagate delay signals unevenly across interconnected software components. Microservices located deep within the call stack experience starvation while outer entry points continue accepting active network connections.
Callers register client-side connection timeouts long before downstream diagnostic logs capture the root thread lock.
Distributed tracing frameworks fail to aggregate spans when trace buffers drop telemetry events under high memory load. Telemetry loss creates diagnostic blind spots exactly when system failure points materialize. Operations teams investigate surface-level network symptoms while core database connection pools remain fully depleted.
Latency spikes obscure the physical transition from queue accumulation to full resource exhaustion.
The downstream infrastructure cannot accept further traffic until upstream nodes drop connection rates.
Latency
Response times climb non-linearly once execution thread pools reach eighty percent occupancy. Service response curves demonstrate steep upward shifts as queuing delays dominate total processing time. High-velocity environments running without concurrency controls drift rapidly into state saturation.
Monitoring absolute response time distributions provides early indication of impending thread pool collapse.
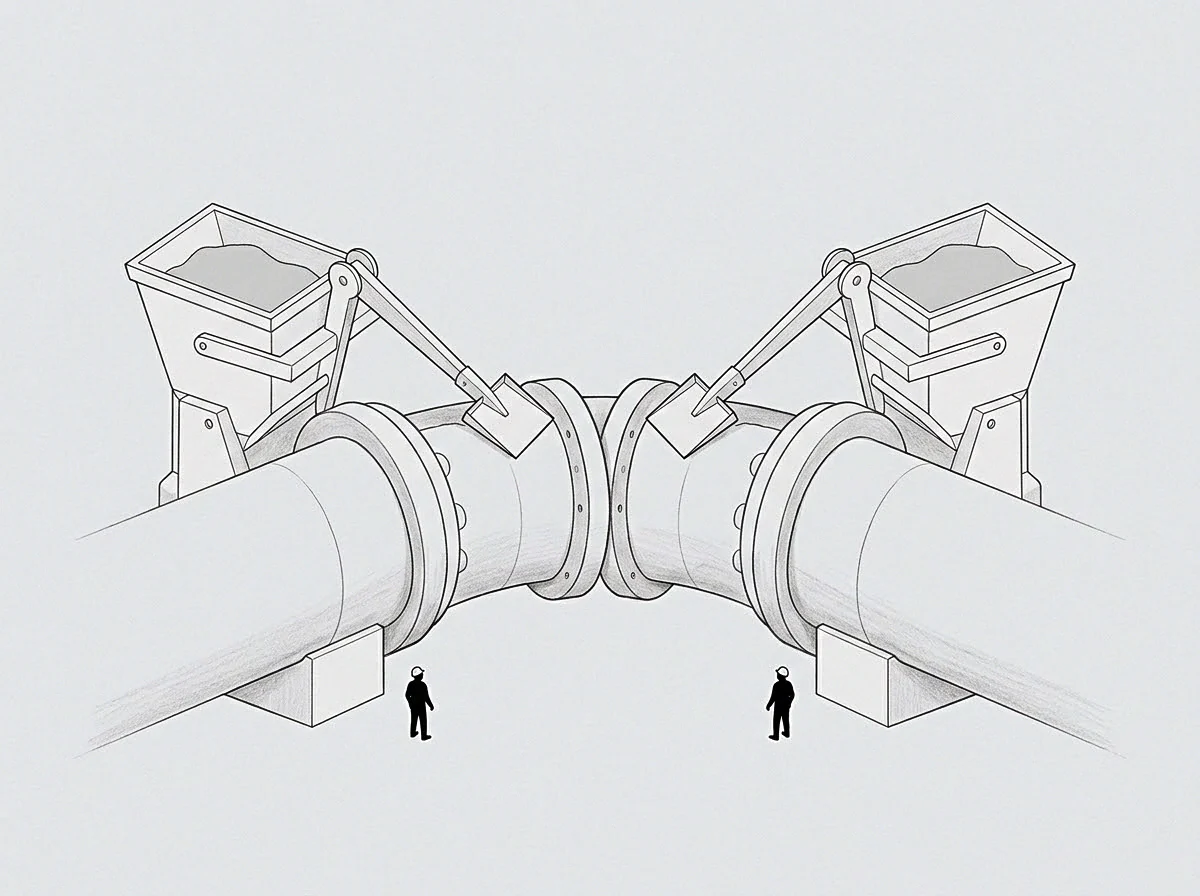
Operational Degradation Dynamics Across Microservice Chains
Service dependencies multiply single-node delays into systemic throughput blocks. When an internal component delays response execution by one hundred milliseconds, calling services hold connection sockets open for that extended duration. Connection pools upstream deplete rapidly, spreading resource contention backward toward edge proxies.
System throughput drops across the entire application ecosystem within seconds of a localized delay spike.
High concurrency without rate limiting forces downstream thread pools into state locks once memory saturation exceeds ninety percent.
System throughput depends directly on strict internal queue management and explicit concurrency limits across all interfaces.
- Thread Pool Exhaustion happens when incoming execution requests exceed active worker capacity, locking CPU scheduling pipelines completely.
- Garbage Collection Stalls pause active runtime execution while memory reclaim operations sweep large heap spaces under continuous allocation pressure.
- Connection Pool Starvation prevents services from opening database sockets, delaying downstream request completion across all application workers.
A continuous load profile with zero ingress control converts transient latency spikes into permanent service outages. Take two payment processing services operating under shared database connection limits. The first service processes batch transactions without rate bounds, using ninety percent of available database sockets.
The second service handles real-time user checkout requests. Under continuous operational strain, real-time requests stall as batch queries occupy active connections. Total platform throughput degrades despite low CPU usage on application servers.
Setting maximum concurrency limits on database connection pools forces batch processes to queue externally, preserving real-time execution bandwidth.

Capacity
System memory consumption patterns shift abruptly when request queues overflow reserved memory blocks. Dynamic memory allocation introduces overhead that scales with queue length. Engineering teams must measure physical limits rather than theoretical calculated limits to maintain system operational stability.

Memory Limits and Backpressure Isolation
Backpressure signals must propagate upstream to prevent client request accumulation in heap memory. When worker nodes run out of processing headroom, edge proxies drop low-priority traffic at the network edge. Dropping requests at entry points preserves core service health, enabling ongoing processing of active requests.
Unthrottled operation ignores backpressure feedback, allowing incoming streams to destroy state consistency.
- Network interface cards drop incoming frames at the hardware layer when kernel ring buffers reach capacity limits.
- Edge routing proxies reject surplus TCP connections, enforcing client-side backoff algorithms immediately upon queue saturation.
- Downstream microservices return standardized payload responses containing explicitly calculated backpressure retry windows.
A stated concurrency limit transfers execution backpressure to the ingress layer before internal thread exhaustion occurs.
Uncontrolled growth in active state tables exhausts available memory allocations, causing unpredictable system kernel failures.
Continuous unthrottled operations eventually hit hardware memory walls regardless of software efficiency.
Buffer
Temporary memory space holds incoming packets while processing threads complete active execution cycles. Buffer sizing determines the resilience of high-velocity systems under volatile load spikes. Excessively large buffers mask underlying processing bottlenecks, creating immense latency tails before failure occurs.
Excessively small buffers cause immediate packet loss during minimal throughput variance.
Transient Storage Behavior Under Continuous Strain
Ring buffers operating under continuous unthrottled ingress reach steady-state fill levels within seconds of activation. When execution speeds match ingress speeds, buffer occupancy remains stable. Any continuous deficit in processing speed causes buffer saturation, locking input channels completely.
The node enters a non-responsive state while memory managers struggle to process backlog queues.
Unthrottled execution paths convert unmanaged ingress volume directly into silent downstream state failure.
Node metrics freeze. Data flow stops. Memory allocation limits hold, but active execution halts entirely due to lock contention.
Operating without active load shedding transforms temporary traffic bursts into permanent operational outages. Engineers must continuously recalibrate buffer boundaries against real-world hardware profiling data.
Which internal metrics accurately reflect true downstream queue capacity before memory exhaustion occurs?
Drift
System behavior diverges from initial performance baseline measurements after forty-eight hours of continuous operation. Resource leakage accumulates slowly across complex software components, diminishing available heap space over extended operational cycles. High-velocity environments experience subtle operational degradation that telemetry metrics fail to attribute to single code changes.
Memory fragmentations reduce continuous block availability, increasing allocation costs for subsequent request processing.
Operational Degradation Over Extended Unthrottled Sequences
Long-running worker nodes demonstrate gradual degradation in processing efficiency under persistent throughput demands. Garbage collectors spend increasing CPU time organizing fragmented memory spaces. Internal locks experience higher contention rates as queue lengths remain permanently elevated.
System throughput decays steadily despite unchanged external request rates and stable network infrastructure.
Throttling execution flows at defined capacity boundaries isolates services from long-term memory degradation effects. Establishing strict rate limits forces systems to operate within verified memory efficiency zones. Operational clarity returns when engineering teams enforce structural capacity walls over unthrottled continuous growth targets.
Continuous execution demands strict structural boundaries to prevent systemic runtime degradation over extended operational lifetimes.